End‑of‑line (EOL) machines are the final gatekeepers before finished goods leave the plant. When a palletizer, shrink‑wrapper, or laser‑guided vehicle (LGV) stops unexpectedly, every upstream filler, labeler, and case packer is forced to wait, turning productive minutes into expensive idle time. Tracking a well‑chosen set of key performance indicators (KPIs) converts those hidden losses into clear numbers that engineers can act upon. This guide explains why EOL KPIs matter, outlines the metrics OCME USA recommends, and provides a practical roadmap for launching a KPI program that translates data into sustainable gains.
Why End‑of‑Line KPIs Matter
EOL assets sit at the junction between production and outbound logistics. Their position means that a single unplanned stop downstream can waste thousands of vials, bottles, or cartons already on the conveyor. Recording KPIs achieves three benefits:
- Reveals hidden losses that routine shift reports often miss.
- Builds an objective business case for capital and maintenance budgets.
- Guides operators and technicians toward faster, safer changeovers and repairs.
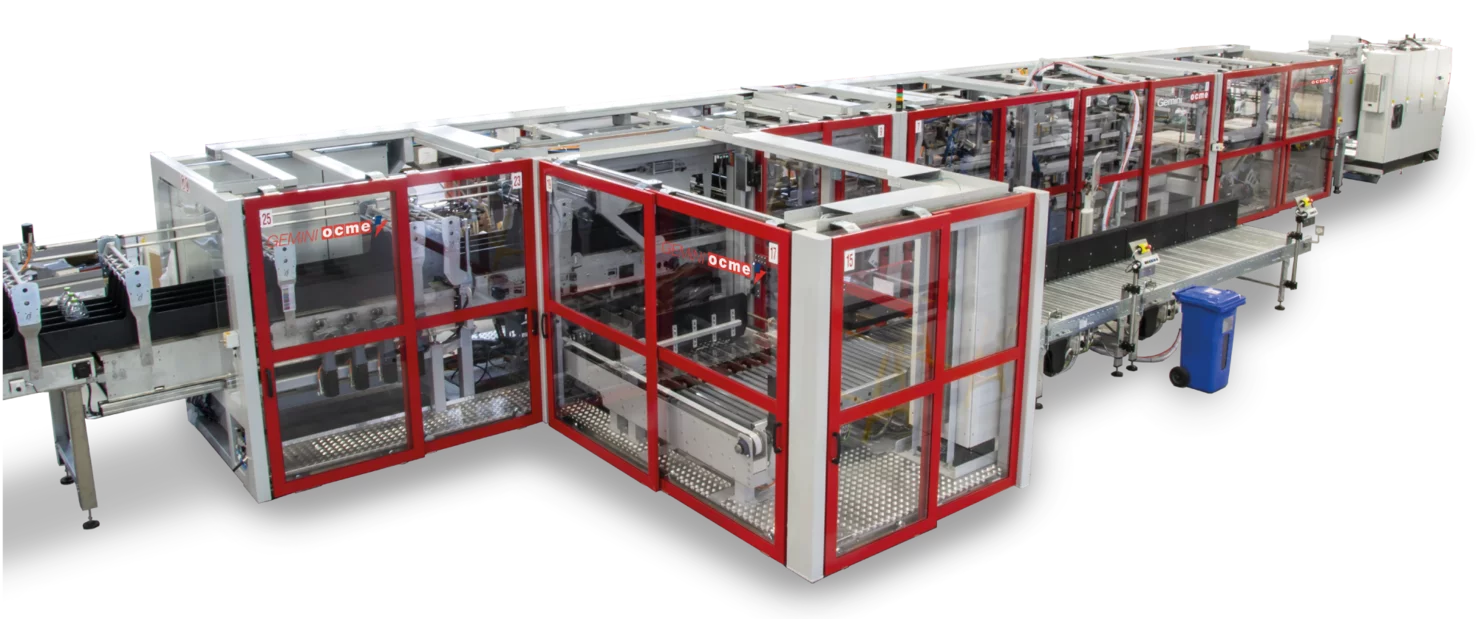
OCME USA equips its Vega shrink‑wrappers, Gemini combi packers, Orion palletizers, and Auriga LGVs with industrial sensors, OPC‑UA tags, and historian modules so that every event—from a micro‑stop to a batch changeover—appears instantly on a line dashboard. With the data already streaming, the only remaining task is to define which KPIs deserve daily attention.
The OCME USA KPI Framework
OCME USA divides EOL indicators into five families: Productivity, Availability, Quality, Cost, and Sustainability. Together, they give managers a balanced scorecard.
1. Overall Equipment Effectiveness (OEE)
Formula: Availability × Performance × Quality.
OEE answers the big question: “Out of the time we scheduled, what percentage did we spend making saleable product at design speed?” The Vega HT shrink film packers strengthen the Performance factor through patented film splicing and automatic format recall. Downtime reasons feed straight into the supervisor platform so that Availability is calculated without manual input.
Target benchmark: World‑class plants aim for 85 percent or higher, but even mature packaging lines frequently sit between 60 and 75 percent.
2. Throughput (Cases per Minute)
Throughput is the first number executives scan on the morning report. Gemini HT combi packers reach up to 100 cartons per minute and remain synchronized with the Orion conventional in‑line palletizer. Plotting hourly throughput against the planned schedule highlights creeping micro‑stops long before they ruin the shift budget.
3. Changeover Time
Every minute spent swapping film reels, guide rails, or glue settings erodes daily capacity. Quick‑release parts and electronic adjustments on Vega HT cut the physical steps to a minimum, letting crews transition from one SKU to the next in less than 15 minutes. Record start‑to‑start changeover times for each SKU family, then rank the outliers that need procedural tweaks.
4. Unplanned Downtime
Availability can be expressed more specifically as:
Planned runtime ÷ (planned runtime + unplanned stops)
OCME USA backs this metric with a 24 / 7 remote support team whose response windows turn hours of troubleshooting into minutes. The supervisor dashboard lists alarms by frequency and duration, enabling a Pareto approach to root‑cause elimination.
5. Mean Time Between Failures (MTBF) and Mean Time to Repair (MTTR)
- MTBF measures reliability: the average operating time between consecutive failures.
- MTTR measures maintainability: the average time required to restore functionality.
Brushless motors, centralized lubrication, and field‑replaceable wear parts extend MTBF across the OCME USA range. Remote diagnostics built into the supervisor, combined with spare parts kits, reduce MTTR. Pairing these values shows whether preventive maintenance intervals are too short, too long, or just right.
6. First‑Pass Yield (FPY) and Reject Rate
FPY represents the share of cases that pass inspection on the first try, while Reject Rate counts the opposite. Precision layer forming on Orion palletizers and servo‑controlled film tension on shrink‑wrappers minimize misalignments, bursts, and crushed corners that create rework. Capture reject counts at the check‑weigher and divide by total cases to obtain FPY.
7. Energy per Case
Shrink‑tunnel heaters and palletizer drives often dominate a facility’s electricity bill. Gas tunnel retrofits and regenerative drives offered on Vega and Orion machines limit consumption. By logging energy meters and normalizing by finished cases, engineers create an actionable Energy per Case trend line. Sudden spikes signal mechanical friction, sensor faults, or poor machine alignment.
8. Cost per Case and Total Cost of Ownership (TCO)
Cost per Case gathers direct labor, consumables, and utilities into one figure. Adding depreciation, planned maintenance, and warranty agreements produces a longer‑term view known as Total Cost of Ownership. OCME USA’s modular service agreements flatten maintenance expenditure and stabilize TCO over a ten‑year horizon, turning variable shocks into predictable monthly accruals.
9. Labor Utilization
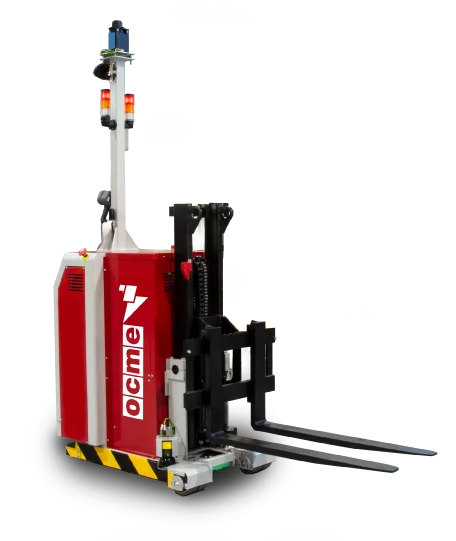
Automatic guided vehicles such as the Auriga laser-guided vehicle move pallets from palletizer discharge to stretch‑wrapper without drivers. Recording labor hours per 1,000 cases before and after LGV deployment quantifies savings in a language the finance team understands.
10. Sustainability Indicators
Thinner films, right‑sized cartons, and energy‑efficient drives influence both cost and environmental KPIs. R&D advances on Vega and Gemini machines enable down‑gauged materials without tearing, while Orion palletizers apply precisely the stretch film needed to achieve load‑stability targets. Tracking Waste per Case alongside Energy per Case gives a complete ESG snapshot that auditors can verify.
How to Launch a KPI Program
1. Baseline the Current State
Choose a representative production week and log every KPI listed above. Use the supervisor historian for machine data and the enterprise resource planning (ERP) system for labor, utility, and consumable costs.
2. Set SMART Targets
Specific, measurable, achievable, relevant, and time‑bound targets convert raw numbers into commitments. Typical goals include:
- 85 percent OEE on the primary packaging line within six months.
- Sub‑15‑minute average changeovers across all SKUs by the next quarter.
- Less than 1 percent total rejects before year‑end.
3. Prioritize the Biggest Losses
Export downtime codes into a Pareto chart. Tackling the top three causes often recovers more availability than addressing twenty minor ones. If film splicing errors dominate, for example, schedule a workshop with OCME USA technical support to retrain operators and calibrate sensors.
4. Leverage Digital Tools
Activate historian exports and integrate them with the plant MES or a business‑intelligence platform such as Power BI. Dashboards that update every fifteen minutes keep supervisors ahead of developing issues and reinforce daily accountability.
5. Train the Team
Operator upskilling has a direct, measurable impact on KPIs. The OCME USA Training Academy offers modular courses that can be customized to plant‑specific goals. Topics range from advanced changeover techniques to first‑pass fault diagnosis.
6. Audit Monthly
Create a standing cross‑functional meeting where maintenance, production, quality, and supply‑chain leads review KPI trends against open action items. Publish a one‑page summary on the notice board so that every shift sees progress and priorities.
EOL efficiency can no longer rely on intuition. By selecting a balanced KPI scorecard—anchored in OEE, throughput, changeover time, downtime, reliability, quality, energy, cost, labor, and sustainability—and pairing each metric with OCME USA machines and services designed to improve it, packaging managers gain a 360‑degree view of performance. When the numbers move in the right direction, uptime climbs, Cost per Case falls, and environmental goals transition from slogans to daily practice.
If you are ready to benchmark your operation, contact our packaging specialists for a no‑obligation KPI assessment. Together, we can elevate every case, layer, and pallet that leaves your line.